These are the best beaches in Colombia in October, based on average sunshine, sea temperature, rainfall and temperature. Though many factors can come into play when choosing your beach destination, the beach weather will often be a deciding factor. Here we list the top beaches based on the average weather conditions and sea temperature.
October has average maximum temperatures of 32°C (90°F) which is very hot and perfect for sunbathing on clear days. The sunshine percentage is 56% making it quite sunny but with occasional periods of cloudy and overcast skies. There are 6.6 hours of sunshine per day. October has total rainfall of 1.9cm (0.7inches) making it predominantly dry with occasional light showers on very few days. There are just 6.8 days with some rainfall so you can still enjoy the beach on the majority of rain free clear days.
It is a good time for sunbathing in Cabo de la Vela. Sea temperatures are a very warm 29°C (83°F). October is an excellent month for swimming in Cabo de la Vela with very comfortable temperatures for bathing all day.
October has average maximum temperatures of 32°C (90°F) which is very hot and perfect for sunbathing on clear days. The sunshine percentage is 50% making it quite sunny but with regular periods of cloudy and overcast skies. There are 5.9 hours of sunshine per day. October has total rainfall of 1.9cm (0.7inches) making it predominantly dry with occasional light showers on very few days. There are just 6.8 days with some rainfall so you can still enjoy the beach on the majority of rain free clear days.
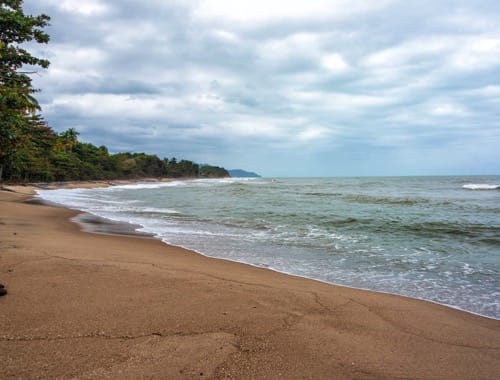
It is a good time for sunbathing in Palomino Beach. Sea temperatures are a warm 23°C (74°F). October is a good month for swimming in Palomino Beach with comfortable temperatures for most people.
October has average maximum temperatures of 32°C (89°F) which is very hot and perfect for sunbathing on clear days. The sunshine percentage is 48% making it quite sunny but with regular periods of cloudy and overcast skies. There are 5.7 hours of sunshine per day. October has total rainfall of 2.6cm (1.0inches) making it predominantly dry with occasional light showers on very few days. There are just 8.9 days with some rainfall so you can still enjoy the beach on the majority of rain free clear days.
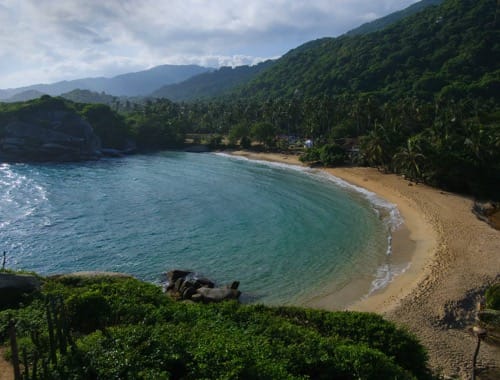
It is a good time for sunbathing in Cabo San Juan. Sea temperatures are a warm 23°C (73°F). October is a good month for swimming in Cabo San Juan with comfortable temperatures for most people.
October has average maximum temperatures of 32°C (89°F) which is very hot and perfect for sunbathing on clear days. The sunshine percentage is 39% making it very cloudy and overcast with some periods of sunshine. There are 4.6 hours of sunshine per day. October has total rainfall of 2cm (0.8inches) making it predominantly dry with occasional light showers on very few days. There are just 6.7 days with some rainfall so you can still enjoy the beach on the majority of rain free clear days.
It is a good time for sunbathing in Isla Mucura. Sea temperatures are a warm 22°C (72°F). October is a good month for swimming in Isla Mucura with comfortable temperatures for most people.
October has average maximum temperatures of 31°C (87°F) which is very hot and perfect for sunbathing on clear days. The sunshine percentage is 36% making it very cloudy and overcast with some periods of sunshine. There are 4.3 hours of sunshine per day. October has total rainfall of 1cm (0.4inches) making it predominantly dry with occasional light showers on very few days. There are just 6.8 days with some rainfall so you can still enjoy the beach on the majority of rain free clear days.
It is a good time for sunbathing in Sapzurro Bay. Sea temperatures are a warm 22°C (71°F). October is a good month for swimming in Sapzurro Bay with comfortable temperatures for most people.
October has average maximum temperatures of 30°C (86°F) which is very warm and perfect for sunbathing on clear days. The sunshine percentage is 36% making it very cloudy and overcast with some periods of sunshine. There are 4.3 hours of sunshine per day. October has total rainfall of 3.3cm (1.3inches) making it predominantly dry with occasional light showers on very few days. There are just 8.7 days with some rainfall so you can still enjoy the beach on the majority of rain free clear days.
It is a good time for sunbathing in Crab Cay. Sea temperatures are a very warm 28°C (83°F). October is an excellent month for swimming in Crab Cay with very comfortable temperatures for bathing all day.
October has average maximum temperatures of 31°C (89°F) which is very hot and perfect for sunbathing on clear days. The sunshine percentage is 39% making it very cloudy and overcast with some periods of sunshine. There are 4.6 hours of sunshine per day. October has total rainfall of 4.5cm (1.8inches) making it mostly dry but with short lived occasional showers. There are only 13.1 days with some rainfall so you can still enjoy the beach on the majority of days.
It is a good time for sunbathing in Rosario Islands. Sea temperatures are a warm 22°C (72°F). October is a good month for swimming in Rosario Islands with comfortable temperatures for most people.
Beaches recommended for you today, this weekend, in the next 2 weeks or in any month of the year.

Beaches recommended for you today, this weekend, in the next 2 weeks or in any month of the year.